

Test Run Data Analysis
Test Run Timeline
4:02 pm – data START on External, Internal, and internal CO2 Scrubber sensors arrays
4:22 pm – seal Test Module
4:27 pm – blower START; pressure rise commences
4:32 pm – max pressure reached
4:36 pm – pan ring reaches approximately chest height, as viewed through the lower lung glass door
4:41 pm – blower STOP; pressure maintained by Test Module lung
…
8:02 pm – data auto-STOP
8:30 pm – open Test Module and release pressure—we were having too much fun and lost track of time 🙂
On Tuesday, June 29, 2021 the SAM development team conducted a fully sealed closure of the Test Module with 5 humans inside, for 4 hours. During this time the team maintained 3 sensor arrays to capture barometric pressure, carbon dioxide, oxygen, temperature, and relative humidity data.
- External sensor array: Vernier LabQuest 3 with barometric pressure, O2 / temperature, and CO2 / temperature / relative humidity (RH) sensors. This array was placed outside the Test Module, near the entrance.
- Internal sensor array: [identical to External] This array was placed inside the Test Module, near the entrance.
- CO2 scrubber sensor array: Vernier LabQuest 3 with two CO2 / temperature / relative humidity (RH) sensor. This array was also placed inside the Test Module to compare the pre-scrubbed and post-scrubbed air. One CO2 sensor was secured at the inlet to the CO2 scrubber; the other inside the scrubber itself, in a chamber located just after the zeolite adsorb bed, before the exit filter and fan array.
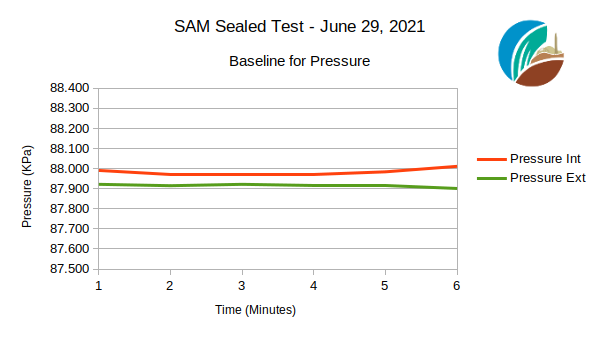
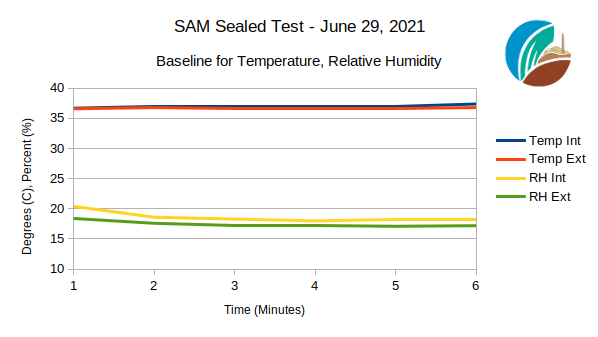
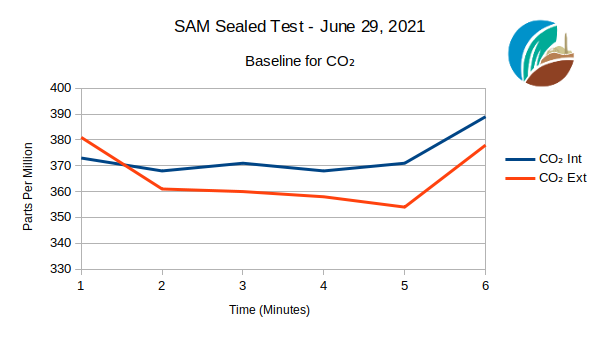
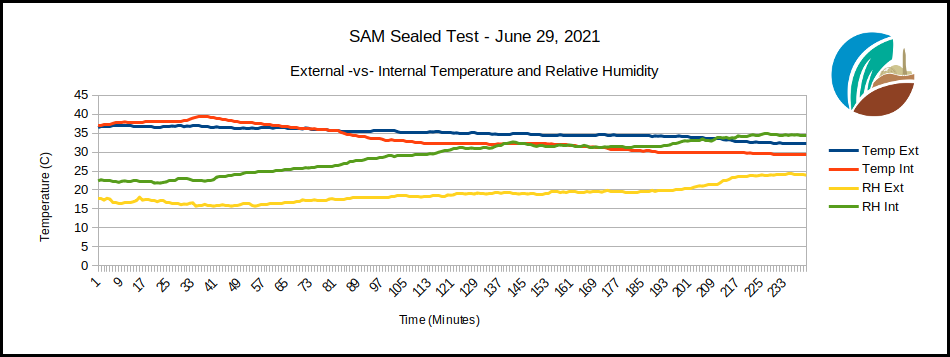
Per the data plots (3 images at top) a baseline comparison of the External and Internal sensor arrays demonstrates that the units were behaving similar to each other before committing to the full 4-hours run. This baseline test was conducted in outside the Test Module, the units placed adjacent to each other. Minor variation in equivalency of the sensors is due to conducting the baseline in an uncontrolled (open air) environment and without post-factory calibration.
It is important to note the small variation in the data stream is the anticipated “noise” of any sensor, and that data sampling was principally conducted to validate the seal of the Test Module, not for peer reviewed publication of findings. Additional steps will be taken to further qualify the sensor array and associated data for future research and publications.
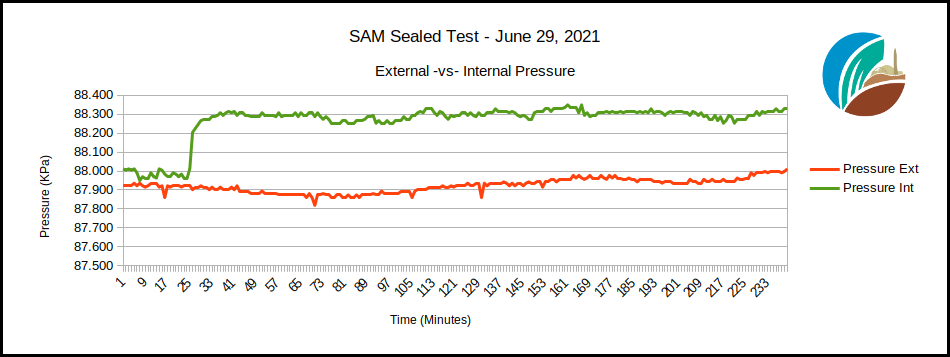
Absolute Barometric Pressure
Following the baseline test (above), the Internal and Scrubber sensors arrays were reset and brought into the Test Module. The team consisting of Kai Staats, Trent Tresch, John Adams, Katie Morgan, and a writer entered the Test Module. The door was sealed and the blower activated as is indicated on the (above) plot by a rapid rise of the internal pressure. It took only a few minutes for the lung pan to rise from the floor, the higher pressure then retained for duration of the Test Run.
It is important to note that while the outside temperature dropped 4.2C and the internal temperature dropped 7.8C (a single, 2T mini-split heat pump is employed at this time) during the 4 hours run, the pressure invoked by the mass of the lung remains relatively constant once it is lifted from the floor. The lung pan lost ~50% of its original height due to temperature change but the pressure was constant until released. In future tests, the height of the lung pan will be monitored in real-time.
Calculating the Mass of the Lung
We can calculate the mass of the rigid lung pan using its radius of 10 feet. While the membrane’s tapered surface and flexible function makes for a constantly changing shape, we can treat it’s lift body as the surface area of a horizontal cross-section from lower lung pan ring to upper lung ring, both of which provide the membrane seal. We’ll add another 3 feet to the radius to account for the membrane, for 13 foot total radius, or 26 foot diameter.
We find the cross-section area of the pan and membrane to be:
Pi x (13’r)^2
x 144 square inches (in^2) per square foot
= 76,454 in^2 total surface area
The mass of the pan is exerting a force on the column of air (measured per square inch) that resides below in addition to the ambient atmospheric pressure. As this body of pressurized air is connected to the Test Module’s interior via the tube, the result is an increase in interior barometric pressure of the Test Module. As we recorded a 0.05 PSI (0.345 KPa) increase in internal atmospheric pressure due to the inflation of the lung and subsequent lifting of the lung pan and membrane:
76,454 in^2 x 0.05 psi = 3,822 lbs
– or –
49.325 m^2 x 0.345 kpa x 101.9 kg per square meter = 1,734 kg
We therefore estimate the metal lung pan and membrane to have a mass of 1,734 kg, or a weight of 3,822 lbs. When we return to SAM in September, we will place a scale beneath each of its six legs and learn how close we came in our calculations.
Relative Humidity, Temperature
As anticipated, the Relative Humidity increased as the Temperature dropped internal to the Test Module. While we did not employ an absolute humidity monitor, it is likely absolute humidity increased as well, given five humans exhaling for four hours. The temperature internal to the Test Module dropped more significantly (-7.8C) than outside (-4.2C) given the mini-split cooling which is more efficient once the sun is no longer directly heating the Test Module.
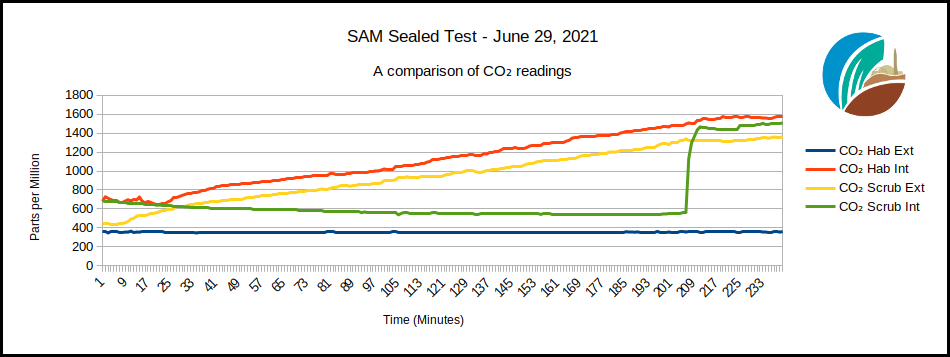
Carbon Dioxide
The CO2 data are perhaps the most interesting to our team. Analysis of the data match our understanding of the Test Module system and its inhabitants to a working degree. Future, controlled tests of sub-systems will improve our ability to model this working vessel as we integrate it into the agent-based model SIMOC.
Per the plot above, there are two sensors in the Test Module interior: CO2 Hab Int (red) and CO2 Scrub Ext (yellow). As noted at the top of this article, CO2 Scrub Ext is external to the CO2 scrubber but internal to the Test Module itself. The data shows they rise in parallel for the duration of the run. Why are they not identical? As demonstrated in the Baseline test, this is likely due to their default calibration and/or variations in CO2 concentrations for even within a single volume there are pools and eddies of air that contain varying densities and partial pressures of component gases. This is well understood and intentionally mitigated with large fans in the Biosphere 2 rain forest biome today.
Clearly, the external CO2 remains constant while the internal CO2 increases as soon as the five team members enter due to human respiration. If we compare the external CO2 baseline to the highest point internal to the Test Module, we see an approximate 1200 increase to just under 1600 parts per million. This is roughly 60 ppm per person per hour. In a future update to this article we’ll compare the average CO2 production for a human at rest against the total volume of the Test Module and Lung interiors to determine if our five team members were high, low, or average.
The CO2 Scrubber
The CO2 Scrub Int (green) sensor was placed inside a sealed chamber such that no air flow was enabled across the zeolites nor through the total CO2 scrubber chamber until two louvers were lifted and the fans engaged. When Trent placed the CO2 sensor inside he was breathing directly into the chamber, thereby artificially elevating and then sealing the enriched air inside. The slow decline over four hours representative of a quality, yet understandably imperfect chamber seal.
As soon as the fans were activated (minute 209) and internal Test Module air was drawn into the scrubber, the CO2 level in that interior chamber rose dramatically, as it should. The function of the zeolites is demonstrated by the flattening of the CO2 levels in the subsequent data points until the run is complete. The small bump at minute 228 is due to a switch from fan #1 to fan #3 with a total increase in airflow. Clearly, this does not equate to an increase in adsorption by the zeolites thereby indicating the airflow likely surpasses the adsorption rate of the given volume of zeolites.
The CO2 scrubber provided by Paragon Space Development Corporation was designed to remove CO2 for 1-7 persons in a volume of air much smaller than the Test Module. While the amount of CO2 generated by a human remains constant independent of the size of the vessel in which they reside, given a larger volume vessel a larger volume of air must be processed to capture the same amount of CO2 over a given period of time. Given this initial run, it appears the current volume of sorbent coupled with the volume of air being processed was able to mitigate but not immediately reduce the CO2 within the Test Module. It is possible that given a longer duration run the scrubber would catch up and manage accordingly, or more likely that the scrubber will need to contain a larger volume of sorbent.
In Closing
It was our intent to complete the redesign of the scrubber to include a desorb function (CO2 release by means of heat and a partial vacuum) by the close of Phase I development at SAM. We were unable to complete this in time for this Test Run, but we did reduce the volume of sorbent contained within the scrubber to minimize the scope of the test medium. However, this also reduced the total volume of sorbent to 64% of its original capacity. If we were to do this again, we’d have simply switched from soda lime to zeolites and retained the full, original capacity of the Paragon scrubber until we move into Phase II at SAM with additional resources and time for experimentation.
Future, controlled tests will refine our understanding of this unit, the use of zeolites, and how best to implement this physico-chemical CO2 mitigation agent in our fully constructed SAM crew living space, adjacent to the Test Module.
As noted at top, we did employ O2 sensors but are honestly confused by the data. We’ll return to this article with an update as we come to a better understanding.
Test Module Dry Run | Five Persons Sealed Inside | Data Analysis