

For better or for worse, all modern homes, offices, and classrooms are fairly tightly enclosed to reduce energy loss. This results in greater than outdoor ambient carbon dioxide levels, higher than most people realize. With ambient global CO2 at 420 parts per million (ppm) it is not unusual for an indoor, occupied space to be well over 1000 ppm, sometimes 1500, 2500, or more. Offices, classrooms, conference halls, even your dining room with a family gathering are in these higher ranges for extended periods of time.
OSHA suggests that the upper, safe limit is exposure to 5000 ppm for up to 8 hours. The International Space Station operates between 3000 and 6500 ppm. And the US Navy submarines are unconfirmed to operated as high as 10,000 ppm. There is little evidence to suggest that any short- or long-term health issues are associated with the upper ranges of CO2 for brief (a few hours) exposures. The astronauts on the ISS live with 5000 ppm for up to a year. While some research shows reduced cognitive function (e.g. math problem solving), there are is no risk of long term damage.
As SAM is hermetically sealed, we must monitor the CO2 levels even more carefully than in our homes, schools, and places of work. While an office might rise over 1500 on a frequent basis, the door is likely being opened, with people moving in and out with the effect of mixing the air.
For these first two mission, SAM is operating in Mode 2 (pressurized, flow-through). The crew is able to adjust valves in the Test Module, airlock and crew quarters and then the speed of the in-bound blower. The combination of the two affects the overall carbon dioxide in SAM.
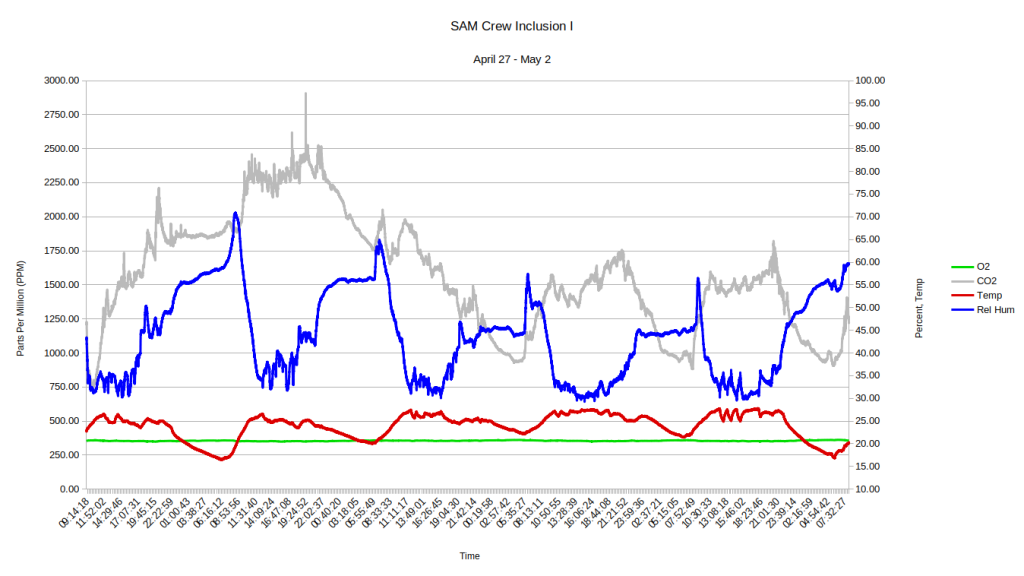
Crew Inclusion I reached out on Day 2 with concern for the rising CO2. Director of Research Kai Staats logged into the SIMOC Live server to retrieve the data to that moment. SIMOC Live captures carbon dioxide, oxygen, relative humidity, temperature, pressure, and a number of other values for the duration of the mission. This data is exported to a local .csv file which the SIMOC-SAM team members can copy through a data backdoor that bypasses the router which limits crew to email only.
As with all time-series data, it takes a full cycle (in this case day-night-day) to recognize a trend. Indeed, the initial rise in CO2 climbed over 2500. This is nothing to be concerned about, but the crew wanted to bring it down, in part to demonstrate their ability to control the quality of air.
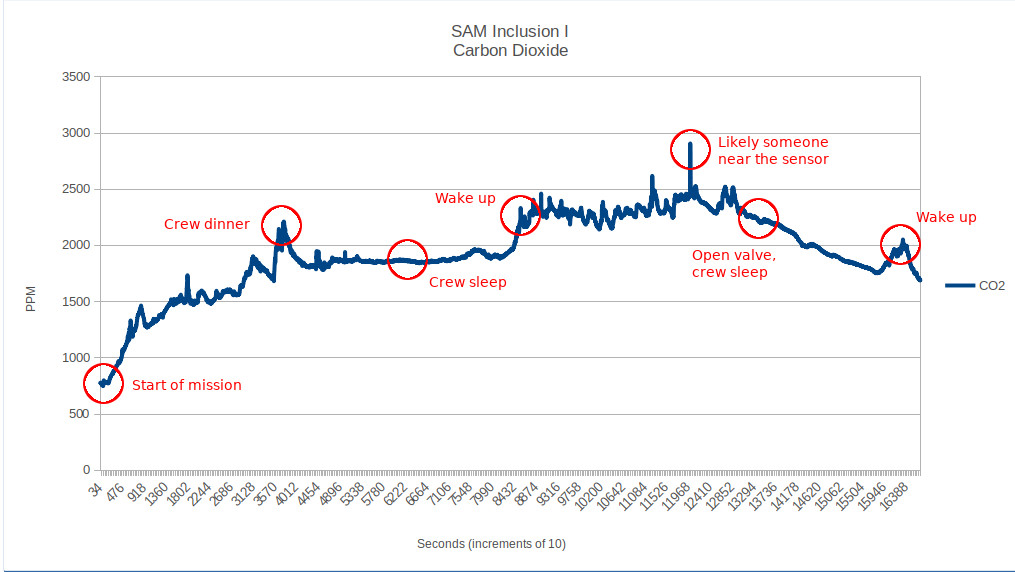
Crew Inclusion I worked extensively with SAM Mission Control to monitor and maintain the carbon dioxide levels. Crew engineer Bailey Burns conducted spot assessments of CO2 throughout the habitat while the SIMOC Live sensor array was capturing a time series dataset from closure to the end of the mission. Bailey’s data confirmed the air flow from SAM Lung to TM to Engineering Bay to Crew Quarters with an increasing density of carbon dioxide.
Mission Control advised that the sound muffler be removed from the outlet at the end of the crew quarters and an additional port be opened in the airlock. While the airlock is not at the termination of the designated airflow path, it does invoke the need to increase the blower in order to keep the lung at a nominal height, and therefore is in fact moving more air with the effect of bringing overall CO2 levels down.
In response to the crew’s request for assistance, acting CapCom Kai Staats wrote, “You have done well to reduce your carbon dioxide over the past two days. You started at roughly 700 ppm (due to all the activity inside SAM prior to entry) and rose to nearly 3000 ppm which is when you reached out for guidance. The day/night activity/sleep cycle is clearly present with a leveling of CO2 while you sleep. But overall, the trend has been down with a reading this morning of just under 1000 ppm. According to the data, you rose at 6 am.”
(see plot above for associated data points and graphical narrative)
The temperature held relatively steady, between 20 and 25C, with a dip to 16C the first night. The relative humidity ranges from 30% to 70%, clearly following a day/night cycle. This is due to “relative” humidity as a measure of moisture in the context of changing temperature, and therefore density of air. But is also due to the fact that at night the A/C units stop running their condensers, therefore the dehumidification function terminates and the humidity rises until the temperature is again high enough to activate the cooling cycle.
In the end, Crew Inclusion I was able to control their CO2 levels effectively (as demonstrated in the graph above). Given initial concerns for CO2 levels, the SAM team now realizes the importance of asking our visiting research crew to reduce their caffeine and processed sugar intake prior to arrival to SAM.